|
Related Topics
|
|
Category: Dow Jones, Nasdaq and S&P 500
Date: 16 August 2020 We take a look at the performance of the Dow Jones, Nasdaq and S&P 500 for the week ending 14 August 2020. It was a very positive week for all three major US market indices and in what is not uncommon these days, the Dow Jones outperformed both the S&P 500 and Nasdaq during the week.
|

|
In our recent studies and other week ending performance articles the Nasdaq and S&P 500 tended to outperform the Dow Jones and the S&P 500. However for the week ending 14 August 2020 the Dow was the best performer while the Nasdaq was the worst performer."
Dow Jones, Nasdaq and S&P 500 all recorded positive returns for the week ending 14 August
The image below shows the returns of the Dow Jones (DJIA), Nasdaq and S&P 500 over the last week (10 August 2020 to 14 August 2020). As we mentioned in the introduction for not the first time in recent weeks the Dow Jones has outperformed both the S&P 500 and the Nasdaq. And this comes after many years of underperformance of the Dow Jones, especially against the tech heavy Nasdaq
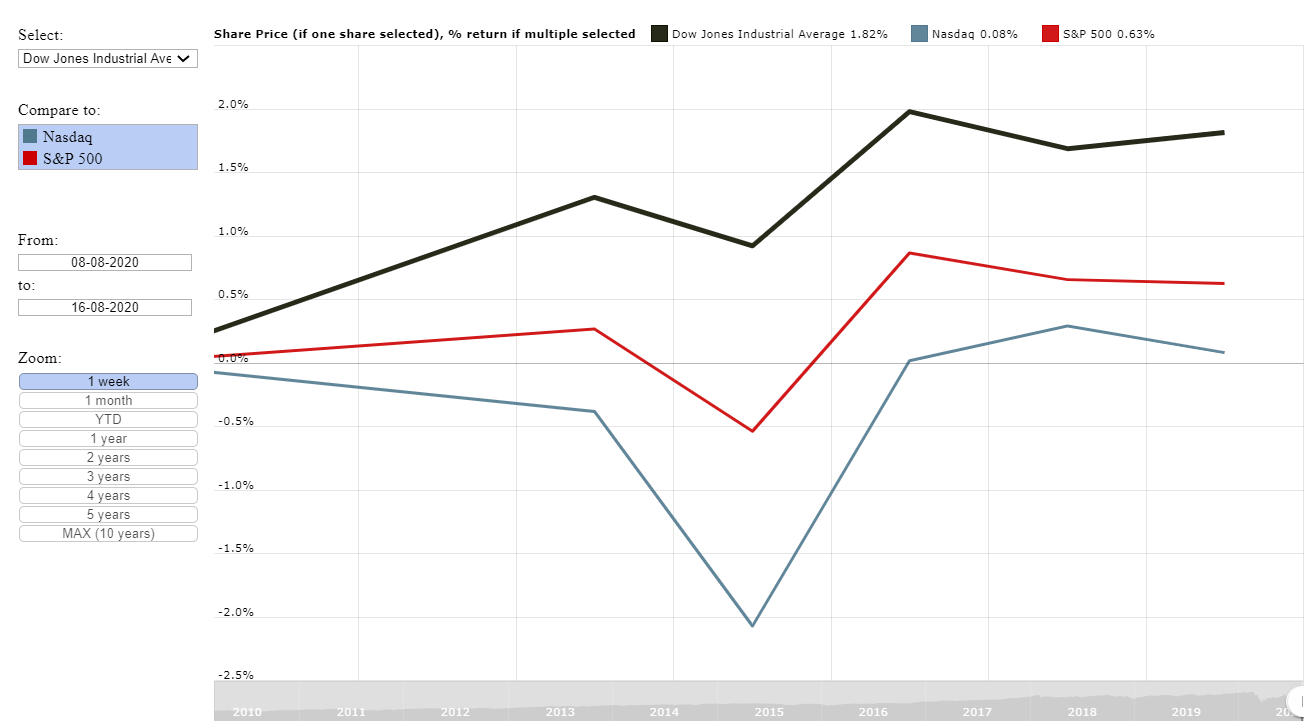
Graph of the Dow Jones, Nasdaq and S&P 500 performance for the week ending 14 August 2020
In our recent studies and other week ending performance articles the Nasdaq and S&P 500 tended to outperform the Dow Jones and the S&P 500. However for the week ending 14 August 2020 the Dow was the best performer while the Nasdaq was the worst performer.
Below the returns of the main market indices over the last week, 10 August 2020 to 14 August 2020 (sorted from best performer to worst performer)
We are however surprised at the current strength of the financial markets considering the fact that there is an alarming spike in the number of coronavirus cases in the the United States. This will have a negative impact on businesses, consumers and the health care sector in general. However the tech stocks reported earnings this week and they all reported very solid results.
Below the returns of the main market indices over the last week, 10 August 2020 to 14 August 2020 (sorted from best performer to worst performer)
- Dow Jones: 1.82%
- S&P 500: 0.63%
- Nasdaq: 0.08%
We are however surprised at the current strength of the financial markets considering the fact that there is an alarming spike in the number of coronavirus cases in the the United States. This will have a negative impact on businesses, consumers and the health care sector in general. However the tech stocks reported earnings this week and they all reported very solid results.
So lets take a look at some of the major market events during the last week
14 August 2020: The Dow Jones ended the day up by 0.12%
Dow Jones updates:
(2:00 ET): Dow Jones futures are currently trading down up by 0.22%
Website updates:
Yesterday we compared the stock of Domino's Pizza to that of Papa Johns in our battle of the pizza franchise stocks
So let's take a look at the fundamentals and the valuation metrics in order to determine which of these two firms offers the most value at their current stock price.
One of our key metrics is the Price to Stockholders equity per share ratio. When looking at this we find the following:
Most firms tend to trade at a ratio of between 2 and 4 times its stockholders equity per share. The higher this ratio the less value a stock offers. However a stockholders deficit shows that a company's assets is less than its liabilities. And this is the case for both Domino's Pizza and Papa Johns.
Next up cash as percentage of stock price:
Next up lets take a look at the percentage cash on the balance sheet makes up of each group's total assets:
Next up the PE ratio of the stock price:
Price relative to our valuation:
Neither of the two companies has stockholders equity, as both are trading at stockholders deficits. Domino's Pizza is in the better cash position than Papa Johns based on the their cash as percentage of total assets percentage. And it is also trading at lower PE ratio than that of Papa Johns but it is trading at further away from our stock price target than what Papa Johns is. And it is for this reasons that we rate the stock of Papa Johns as the winner.
Read the full article here
13 August 2020:
Dow Jones updates:
(12:10 ET): The Dow Jones is currently trading down by -0.18%
(1:30 ET): Dow Jones futures are currently trading down by -0.04%
Website updates:
Yesterday we looked at the market capital of the 10 biggest stocks listed on the NASDAQ. Below a short extract from that article
Market Capital of the 10 largest Nasdaq listed firms (including Microsoft (MSFT), Apple (APPL), Cisco (CSCO) and Intel which is part of the Dow Jones), sorted from the biggest to the 10th biggest
So the top 10 stocks listed on the Nasdaq (including those included in the Dow Jones Industrial Average) total market capital amounts to $7.81 trillion, or about 97.8% of the total market capital of the Dow Jones Industrial Average (which is 30 stocks).
Read the full article here
12 August 2020: The Dow Jones ended the day up by 1.05%
Dow Jones updates:
(14:03 ET): The Dow Jones is currently trading 1%
(07:00 ET): Dow Jones futures are currently trading up by 0.95%
(0:56 ET): Dow Jones futures are currently trading up by 0.21%
Website updates:
Earlier we covered the latest earnings report of Grocery Outlet a retailer with a market cap of over $4 billion and whose sales topped $800 million for their latest report quarter.
So what do we value Grocery Outlet at based on their 2nd quarter 2020 earnings report a? Based on the latest earnings report from Grocery Outlet our valuation model provides a target price (full value price) for Grocery Outlet stock at $36.70 a stock. We therefore believe the stock of Grocery Outlet is overvalued
We usually recommend that long term fundamental or value investors look to enter a stock at at least 10% below our target price, which in this case is $36.70. So we would suggest looking to enter into the stock of Grocery Outlet at $33 or below.
We expect the stock of Grocery Outlet to pull back from its current price to levels closer to our target price in coming weeks and months.
Read the full article here
11 August 2020: The Dow ended the day down by -0.38%
Dow Jones updates:
(14:27 ET): The Dow Jones is currently trading up by 1.1%
(4:10 ET): Dow Jones futures are currently trading up by 1.03%
(1:46 ET): Dow Jones futures are currently trading up by 0.37%
Website updates:
Earlier we covered the latest earnings report of Royal Caribbean Group, formerly known as Royal Caribbean Cruises. Below a short extract
So what do we value Royal Caribbean Group at based on their 2nd quarter 2020 earnings report and the fact that made a significant loss during 1Q 2020? Based on their earnings report and the fact that they are loss making we have decided to value RCL at their stockholders equity per share which is $42.80 a stock. We therefore believe the stock of Royal Caribbean Group is slightly overvalued
We usually recommend that long term fundamental or value investors look to enter a stock at at least 10% below our target price, which in this case is $48.92, so we would suggest looking to enter into the stock of Royal Caribbean Group at $38.50 or below.
We expect the stock of Royal Caribbean Group to pull back slightly from its current price to levels closer to our target price in coming weeks and months.
Read the full article here
10 August 2020: The Dow Jones ended the day up by 1.3%
Dow Jones Updates:
(13:57 ET) The Dow Jones is currently trading up by 1.01%
(4:45 ET): Dow Jones futures are currently trading up by 0.41%
(1:14 ET): Dow Jones futures are currently trading up by 0.33%
Website Updates:
Yesterday we covered the latest earnings report of general home retailer, Conn's (CONN). Below a short extract from that article
So based on Conn's 1st quarter 2021 earnings report what do we value their stock at? It is always hard to value a loss making firm. In the case where a firm is loss making we tend to use the stockholders equity per share as the base of our valuation. And Conn's stockholders equity per share is currently sitting at $17.20. And this is what we will value the group's stock at.
We therefore believe the stock of Conn's is undervalued. Also keep in mind if you buy the stock at $11.03, 90% of that price is made up by cash on the balance sheet. So the rest of the business is purchased for the oter $2 per stock.
We expect the stock of Conn's to rise sharply as the impact of Covid-19 eases.
Read the full article here
Dow Jones updates:
(2:00 ET): Dow Jones futures are currently trading down up by 0.22%
Website updates:
Yesterday we compared the stock of Domino's Pizza to that of Papa Johns in our battle of the pizza franchise stocks
So let's take a look at the fundamentals and the valuation metrics in order to determine which of these two firms offers the most value at their current stock price.
One of our key metrics is the Price to Stockholders equity per share ratio. When looking at this we find the following:
- Price/Stockholders equity per share for Papa Johns (PZZA): Stockholders deficit so this ratio cannot be calculated
- Price/Stockholders equity per share for Domino's Pizza (DPZ): Stockholders deficit so this ratio cannot be calculated
Most firms tend to trade at a ratio of between 2 and 4 times its stockholders equity per share. The higher this ratio the less value a stock offers. However a stockholders deficit shows that a company's assets is less than its liabilities. And this is the case for both Domino's Pizza and Papa Johns.
Next up cash as percentage of stock price:
- Cash as percentage of stock price for Papa Johns: 2.5%
- Cash as percentage of stock price for Domino's Pizza (DPZ): 1.53%
Next up lets take a look at the percentage cash on the balance sheet makes up of each group's total assets:
- Cash as percentage of stock price for Papa Johns (PZZA): 5.1%
- Cash as percentage of stock price for Domino's Pizza (DPZ): 15.7%
Next up the PE ratio of the stock price:
- PE ratio for Papa Johns: 48.3
- PE ratio for Domino's Pizza : 34
Price relative to our valuation:
- Papa Johns (PZZA): 41.8% overvalued based on our latest stock valuation
- Domino's Pizza (DPZ): 89.5% overvalued based on our latest stock valuation
Neither of the two companies has stockholders equity, as both are trading at stockholders deficits. Domino's Pizza is in the better cash position than Papa Johns based on the their cash as percentage of total assets percentage. And it is also trading at lower PE ratio than that of Papa Johns but it is trading at further away from our stock price target than what Papa Johns is. And it is for this reasons that we rate the stock of Papa Johns as the winner.
Read the full article here
13 August 2020:
Dow Jones updates:
(12:10 ET): The Dow Jones is currently trading down by -0.18%
(1:30 ET): Dow Jones futures are currently trading down by -0.04%
Website updates:
Yesterday we looked at the market capital of the 10 biggest stocks listed on the NASDAQ. Below a short extract from that article
Market Capital of the 10 largest Nasdaq listed firms (including Microsoft (MSFT), Apple (APPL), Cisco (CSCO) and Intel which is part of the Dow Jones), sorted from the biggest to the 10th biggest
- Apple (APPL): $1.87 trillion
- Microsoft (MSFT): $1.54 trillion
- Amazon (AMZN): $1.54 trillion
- Alphabet (GOOGL): $1.01 trillion
- Facebook (FB): $729.7billion
- Nvidia (NVDA): $266.9 billion
- Paypal (PYPL): $221.8 billion
- Netflix (NFLX): $209.5billion
- Adobe (ADBE): $208.8 billion
- Intel (INTC): $204.9 billion
So the top 10 stocks listed on the Nasdaq (including those included in the Dow Jones Industrial Average) total market capital amounts to $7.81 trillion, or about 97.8% of the total market capital of the Dow Jones Industrial Average (which is 30 stocks).
Read the full article here
12 August 2020: The Dow Jones ended the day up by 1.05%
Dow Jones updates:
(14:03 ET): The Dow Jones is currently trading 1%
(07:00 ET): Dow Jones futures are currently trading up by 0.95%
(0:56 ET): Dow Jones futures are currently trading up by 0.21%
Website updates:
Earlier we covered the latest earnings report of Grocery Outlet a retailer with a market cap of over $4 billion and whose sales topped $800 million for their latest report quarter.
So what do we value Grocery Outlet at based on their 2nd quarter 2020 earnings report a? Based on the latest earnings report from Grocery Outlet our valuation model provides a target price (full value price) for Grocery Outlet stock at $36.70 a stock. We therefore believe the stock of Grocery Outlet is overvalued
We usually recommend that long term fundamental or value investors look to enter a stock at at least 10% below our target price, which in this case is $36.70. So we would suggest looking to enter into the stock of Grocery Outlet at $33 or below.
We expect the stock of Grocery Outlet to pull back from its current price to levels closer to our target price in coming weeks and months.
Read the full article here
11 August 2020: The Dow ended the day down by -0.38%
Dow Jones updates:
(14:27 ET): The Dow Jones is currently trading up by 1.1%
(4:10 ET): Dow Jones futures are currently trading up by 1.03%
(1:46 ET): Dow Jones futures are currently trading up by 0.37%
Website updates:
Earlier we covered the latest earnings report of Royal Caribbean Group, formerly known as Royal Caribbean Cruises. Below a short extract
So what do we value Royal Caribbean Group at based on their 2nd quarter 2020 earnings report and the fact that made a significant loss during 1Q 2020? Based on their earnings report and the fact that they are loss making we have decided to value RCL at their stockholders equity per share which is $42.80 a stock. We therefore believe the stock of Royal Caribbean Group is slightly overvalued
We usually recommend that long term fundamental or value investors look to enter a stock at at least 10% below our target price, which in this case is $48.92, so we would suggest looking to enter into the stock of Royal Caribbean Group at $38.50 or below.
We expect the stock of Royal Caribbean Group to pull back slightly from its current price to levels closer to our target price in coming weeks and months.
Read the full article here
10 August 2020: The Dow Jones ended the day up by 1.3%
Dow Jones Updates:
(13:57 ET) The Dow Jones is currently trading up by 1.01%
(4:45 ET): Dow Jones futures are currently trading up by 0.41%
(1:14 ET): Dow Jones futures are currently trading up by 0.33%
Website Updates:
Yesterday we covered the latest earnings report of general home retailer, Conn's (CONN). Below a short extract from that article
So based on Conn's 1st quarter 2021 earnings report what do we value their stock at? It is always hard to value a loss making firm. In the case where a firm is loss making we tend to use the stockholders equity per share as the base of our valuation. And Conn's stockholders equity per share is currently sitting at $17.20. And this is what we will value the group's stock at.
We therefore believe the stock of Conn's is undervalued. Also keep in mind if you buy the stock at $11.03, 90% of that price is made up by cash on the balance sheet. So the rest of the business is purchased for the oter $2 per stock.
We expect the stock of Conn's to rise sharply as the impact of Covid-19 eases.
Read the full article here
Chart of the Dow Jones Industrial Average (DJIA) vs Nasdaq vs S&P500 over last 10 years
The graphic below shows the performance of the Dow Jones Industrial Average (DJIA) index over the last month. As soon as a user clicks on the Nasdaq or S&P500 the graphic recalculates and shows the returns of the additional indices selected. The graphic will recalculate the returns if users provide their own dates, within the last 10 year (or they can select predefined dates from our Zoom box in the graphic). Data for the graphic obtained from MacroTrends.Net
Below the returns of the main market indices over the last 12 months (sorted from best performer to worst performer)
So from the above its is clear that the Nasdaq has easily outperformed other major indices such as the S&P 500 and The Dow Jones over the last 12 months. The same can be said about the 2 year performance, 3 year performance, 5 year performance and 10 year performance, as tech giants listed on the Nasdaq has been driving the performance of the Nasdaq.
Below a summary of the returns provided by the three major US stock market indices over the last 10 years:
- Nasdaq: 42.15%
- S&P 500: 18.44%
- Dow Jones (DJIA): 8.98%
So from the above its is clear that the Nasdaq has easily outperformed other major indices such as the S&P 500 and The Dow Jones over the last 12 months. The same can be said about the 2 year performance, 3 year performance, 5 year performance and 10 year performance, as tech giants listed on the Nasdaq has been driving the performance of the Nasdaq.
Below a summary of the returns provided by the three major US stock market indices over the last 10 years:
- Nasdaq: 359.1%
- S&P 500: 186.6%
- Dow Jones (DJIA): 152.7%