|
Related Topics
|
|
Category: Dow Jones, Nasdaq and S&P 500
Date: 2 May 2020 We take a look at the performance of the three major US market indices for the month of April 2020 and compare it to the performance of these indices during the same time period of last year.
|

|
About the Dow Jones Industrial Average (DJIA)
The Dow Jones Industrial Average® (The Dow®), is a price-weighted measure of 30 U.S. blue-chip companies. The index covers all industries except transportation and utilities. The market cap of the Dow Jones firms amounts to $6.523 trillion as at end of March 2020 (down from $7.454 trillion as a tend of February 2020). The Dow Jones Industrial Average has a trailing PE ratio of 19.47 and the PE is projected (forward PE) is at 16.24 with a indicated dividend yield of 2.62% and a price to book value of 3.83.
About the S&P 500
The S&P 500 is widely regarded as the best single gauge of large-cap U.S equities. There is over $9.9 trillion indexed or bench-marked to the index, with the indexed assets comprising approximately $3.4 trillion of this total. The index includes 500 leading companies and covers approximately 80% of the available market capitalization.
Create in 1957, the S&P 500 was the first U.S market-cap-weighted stock market index. Today, it's the basis of many listed and over the counter investment instruments. The world-renowned index includes 500 of the top companies in leading industries of the U.S economy.
To be included in the S&P 500 companies must have an unadjusted market cap of $8.2 billion or greater of which public float mist be at least $4.1 billion. Currently the PE ratio of the S&P 500 is 22.4 (trailing PE) and is projected to be at 17.1. The indicative dividend yield of the S&P 500 is 2.08% with an average price to book value of 3.34
About the Nasdaq
The image below obtained from Google, shows the stock price history of Apple (NASDAQ: APPL) for the last 5 years. And its been a very good time for Apple shareholders. 5 years ago the stock of Apple was trading at around $129.50 a stock and its currently trading at $317.86 a stock. That's a very healthy 145.8% return provided to Apple stockholders over the last 5 years.
The stock of Apple is trading at a lot closer to its 52 week high of $327.85 than it is to its 52 week low of $169.49 a stock, which to us is a clear indication that the short term sentiment and momentum of Apple stock is very positive at this point in time,
The stock of Apple is trading at a lot closer to its 52 week high of $327.85 than it is to its 52 week low of $169.49 a stock, which to us is a clear indication that the short term sentiment and momentum of Apple stock is very positive at this point in time,
Performance of the Dow Jones against the S&P500 and the Nasdaq during April 2020
The image below shows the returns of the Dow Jones Industrial Average (DJIA), Nasdaq and S&P 500 for the month of April 2020. As the image below shows the overwhelming trend for all three major US indices during the month of April 2020 was overwhelmingly negative.
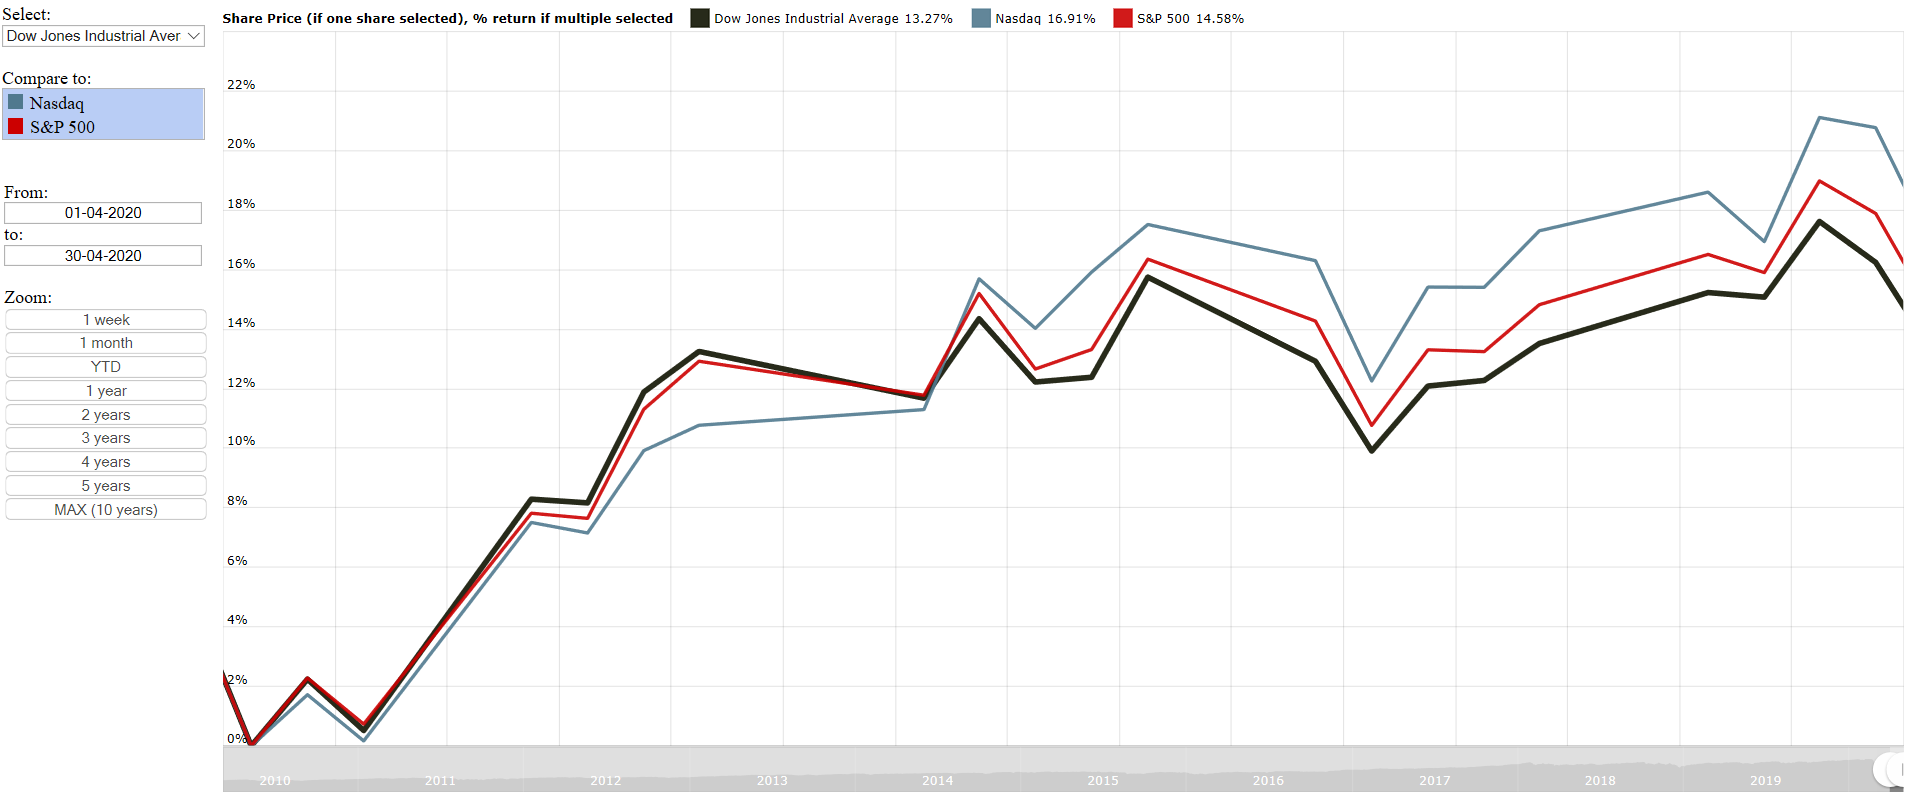
Dow Jones Industrial Average (DJIA) vs Nasdaq vs S&P 500 for April 2020
The summary below shows the performance of the various indices for the month of April 2020 (sorted from best performer to worst performer)
Stellar performance by all three major indices during the month of Apri 2020. In fact it was the best performance for the month of April in many a decade, as markets recovered sharply from the significant sell off in March 2020
- Nasdaq: 16.91%
- S&P 500: 14.58%
- Dow Jones: 13.27%
Stellar performance by all three major indices during the month of Apri 2020. In fact it was the best performance for the month of April in many a decade, as markets recovered sharply from the significant sell off in March 2020
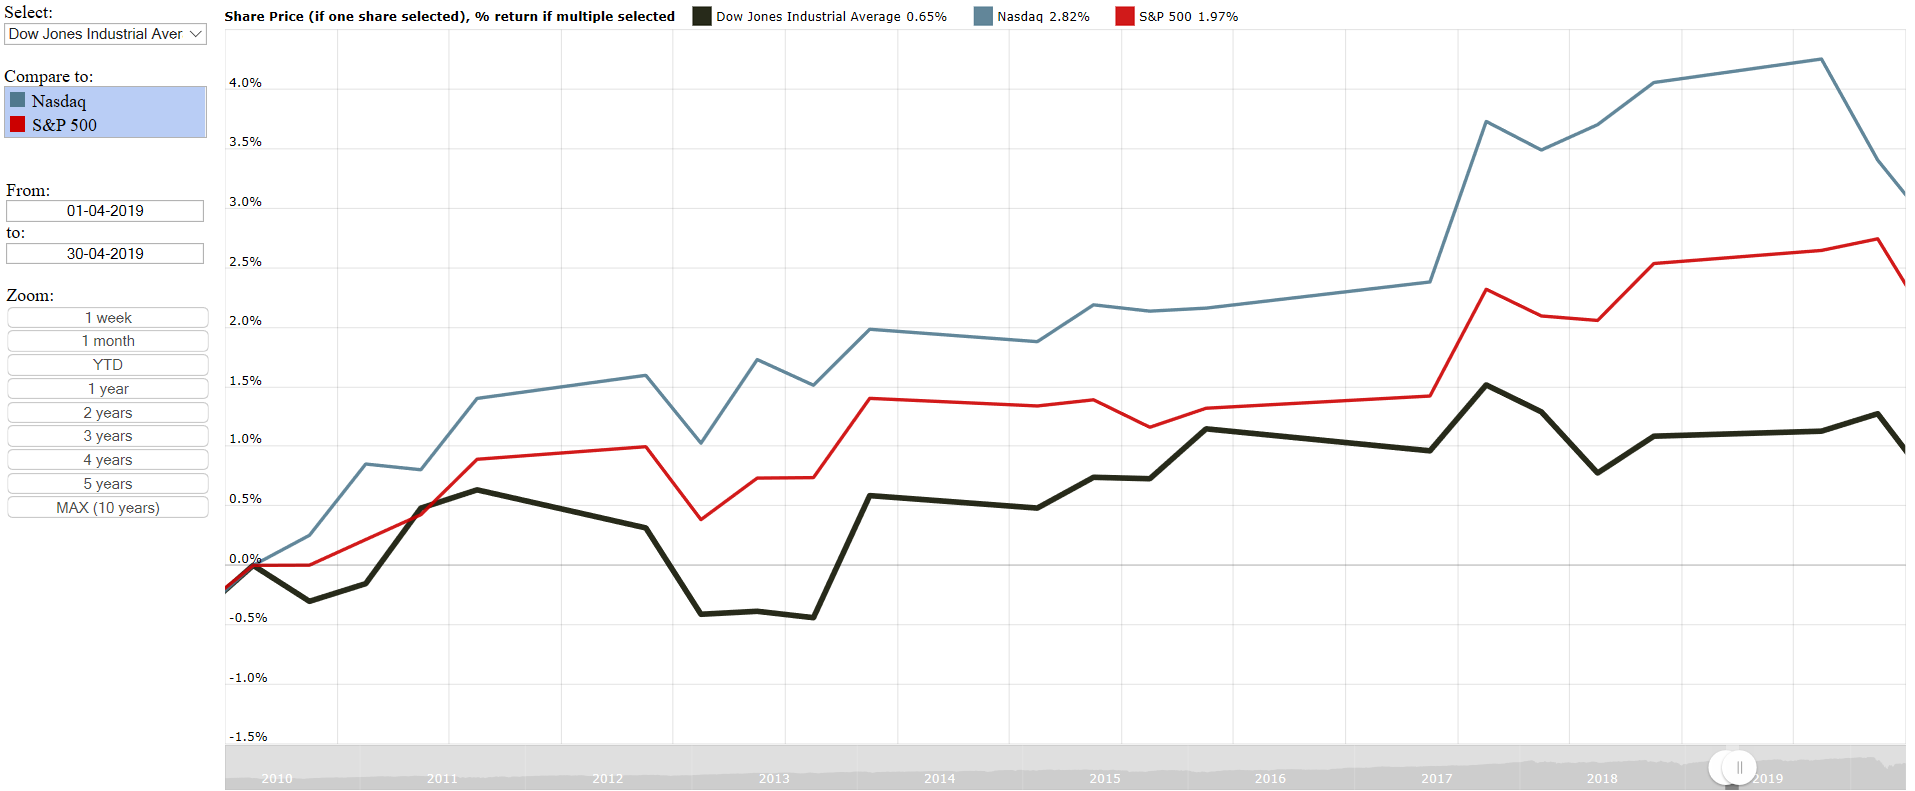
Dow Jones Industrial Average (DJIA) vs Nasdaq vs S&P 500 for April 2019
The summary below shows the performance of the various indices for the month of April 2019 (sorted from best performer to worst performer)
So while both April 2019 and April 2020 provided to be positive months for the Dow Jones Industrial Average (DJIA), the Nasdaq and the S&P 500 the performance of April 2020 was far greater than that of April 2019, as markets recovered extremely quickly to the sell off the previous month, even though some believe the recovery is not fully justified yet, as countries across the world are only starting to open up their economies gradually at this point in time. And in the United States only 30 states are gradually opening up and by the end of next week it is expected that 42 states within the USA would have begun relaxing lockdown regulations and start opening up businesses and regular day to day activities.
- Nasdaq: 2.82%
- S&P 500: 1.97%
- Dow Jones: 0.65%
So while both April 2019 and April 2020 provided to be positive months for the Dow Jones Industrial Average (DJIA), the Nasdaq and the S&P 500 the performance of April 2020 was far greater than that of April 2019, as markets recovered extremely quickly to the sell off the previous month, even though some believe the recovery is not fully justified yet, as countries across the world are only starting to open up their economies gradually at this point in time. And in the United States only 30 states are gradually opening up and by the end of next week it is expected that 42 states within the USA would have begun relaxing lockdown regulations and start opening up businesses and regular day to day activities.